One of the best but trickiest things in a startup team like ours is there are so many ideas we want to build but so little time. So we held another Hack Day to reclaim some time for improvisation! Here’s what we got up to.
Open Source spruce-up
By JT

Even though JT was supposed to be on holiday and far, far away from his computer, he couldn’t resist some hacking. He went around sprucing up a bunch of our open source projects, adding integration with Travis CI, Gitter chat, and badges to show build and NPM status in the READMEs on GitHub.
Here’s a shortlist of projects updated – take a look:
- speed-date – Format dates, fast.
- mmdb-reader – Pure JS reader for MaxMind GeoIP dbs.
- ipcheck – Quickly parse IP addresses and check them for CIDR matches.
- stash – Distributed caching using Redis & in-memory LRU.
- rush – High-throughput lru-caching of data fetches from external resources.
- node-gosquared – Our official tracking module for node.js.
Norm
By Simon
For at least a year now Simon has been wanting to make GoSquared smarter at understanding traffic patterns on websites we track, so he built Norm.
Norm computes a weighted average of the minimum and maximum traffic levels over the previous 4 weeks for each hour. Here are the minimums and maximums plotted alongside the traffic levels for a week and its preceding week:

Not only does this illustrate the typical variance of a site’s traffic, but it can also be used to automatically trigger alerts on unusually high or low traffic levels to detect anomalies. Unexpected variations almost always needs the attention of the site owner, such as low traffic due to technical issues, or high traffic due to promotion.
We want to work this automatic functionality into GoSquared, replacing the need to manually set upper and lower alert thresholds yourself.
Graphing library in Swift
By Ed

We don’t often get a chance to work on iOS development, so it was fascinating to see what Ed came up with: a graphing library written from scratch in Swift.
The library is already able to plot timeline data from the GoSquared API, and has inspired us to think about more possibilities for GoSquared on mobile. I can see more opportunities to bring GoSquared data to mobile in hack days to come.
Dash
For this one, I joined forces with James to attempt an ambitious project we both had in mind ever since the last Hack Day when Eventador was born. The idea was to take Eventador further and build it out as a labs project that any of our customers can make use of with their own data.
After a day of hacking, with James on frontend design, coding & styling and myself on frontend + backend scripting, we produced Dash.
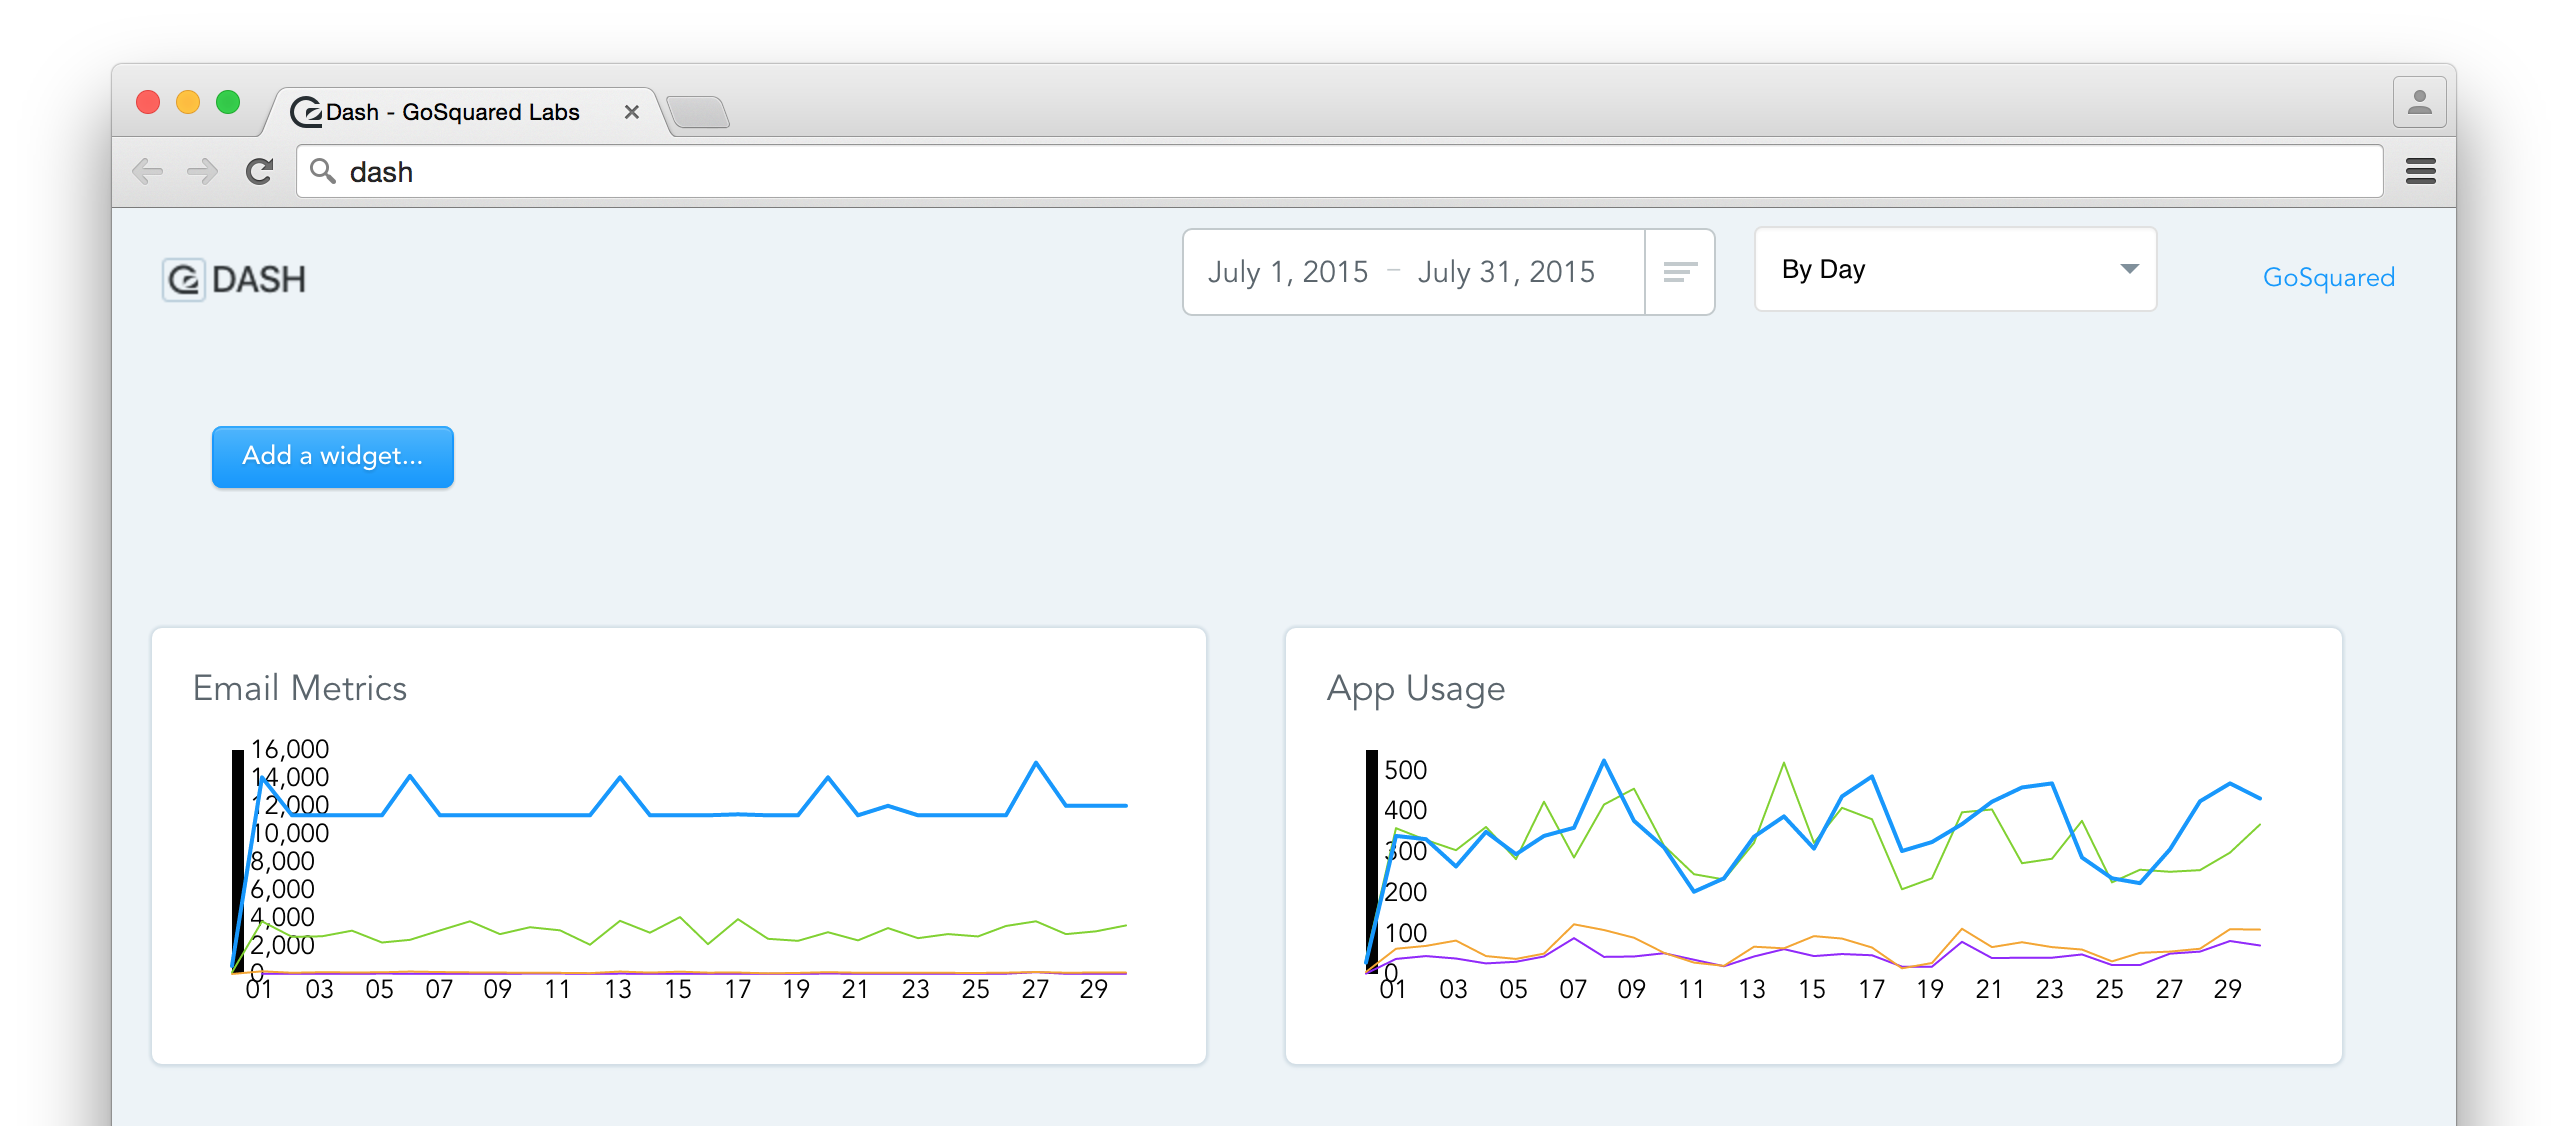
Dash (we didn’t spend time agonising over the name) allows you to visualise events you are tracking with GoSquared in simple, clear, timeseries charts.
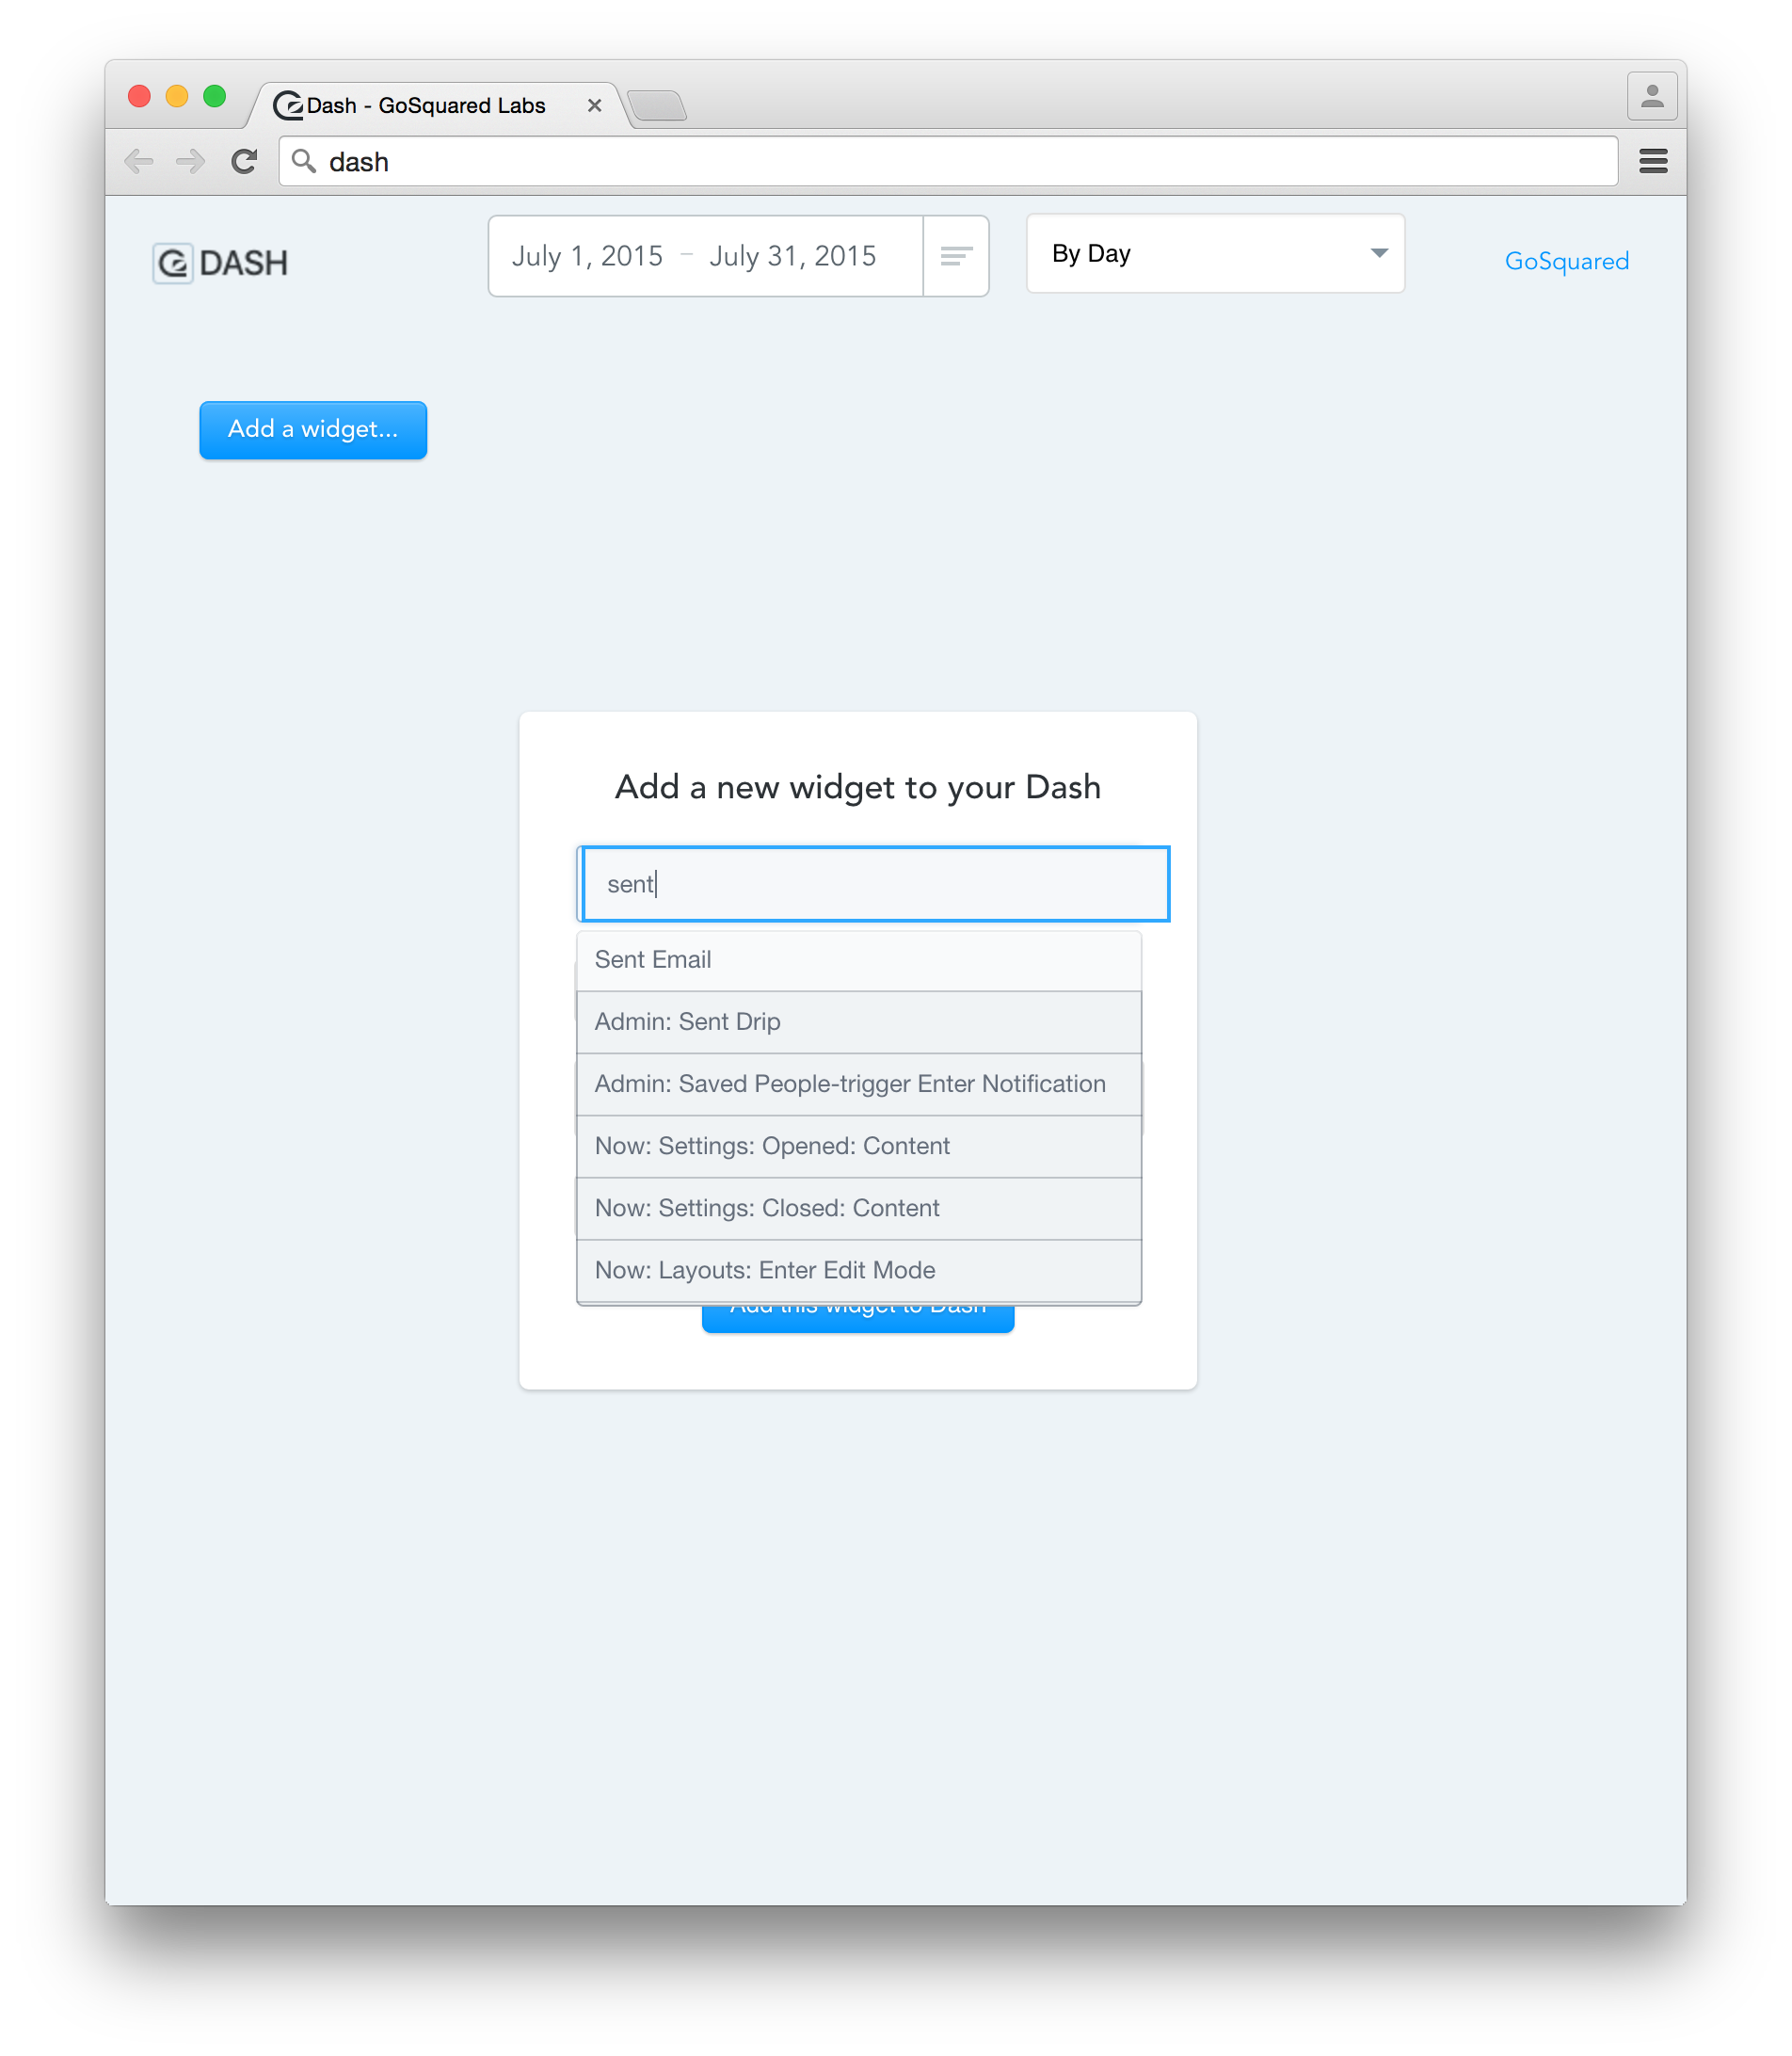
The add widget dialog lets you choose which events to plot, choose between whether to plot number of people or events, and optionally filter the results by people in a particular smart group:

We made use of our very own Tagbox plugin to provide a fuzzy-filterable list of events:
Finally, you can label the widget with a friendly name to describe what’s being shown:

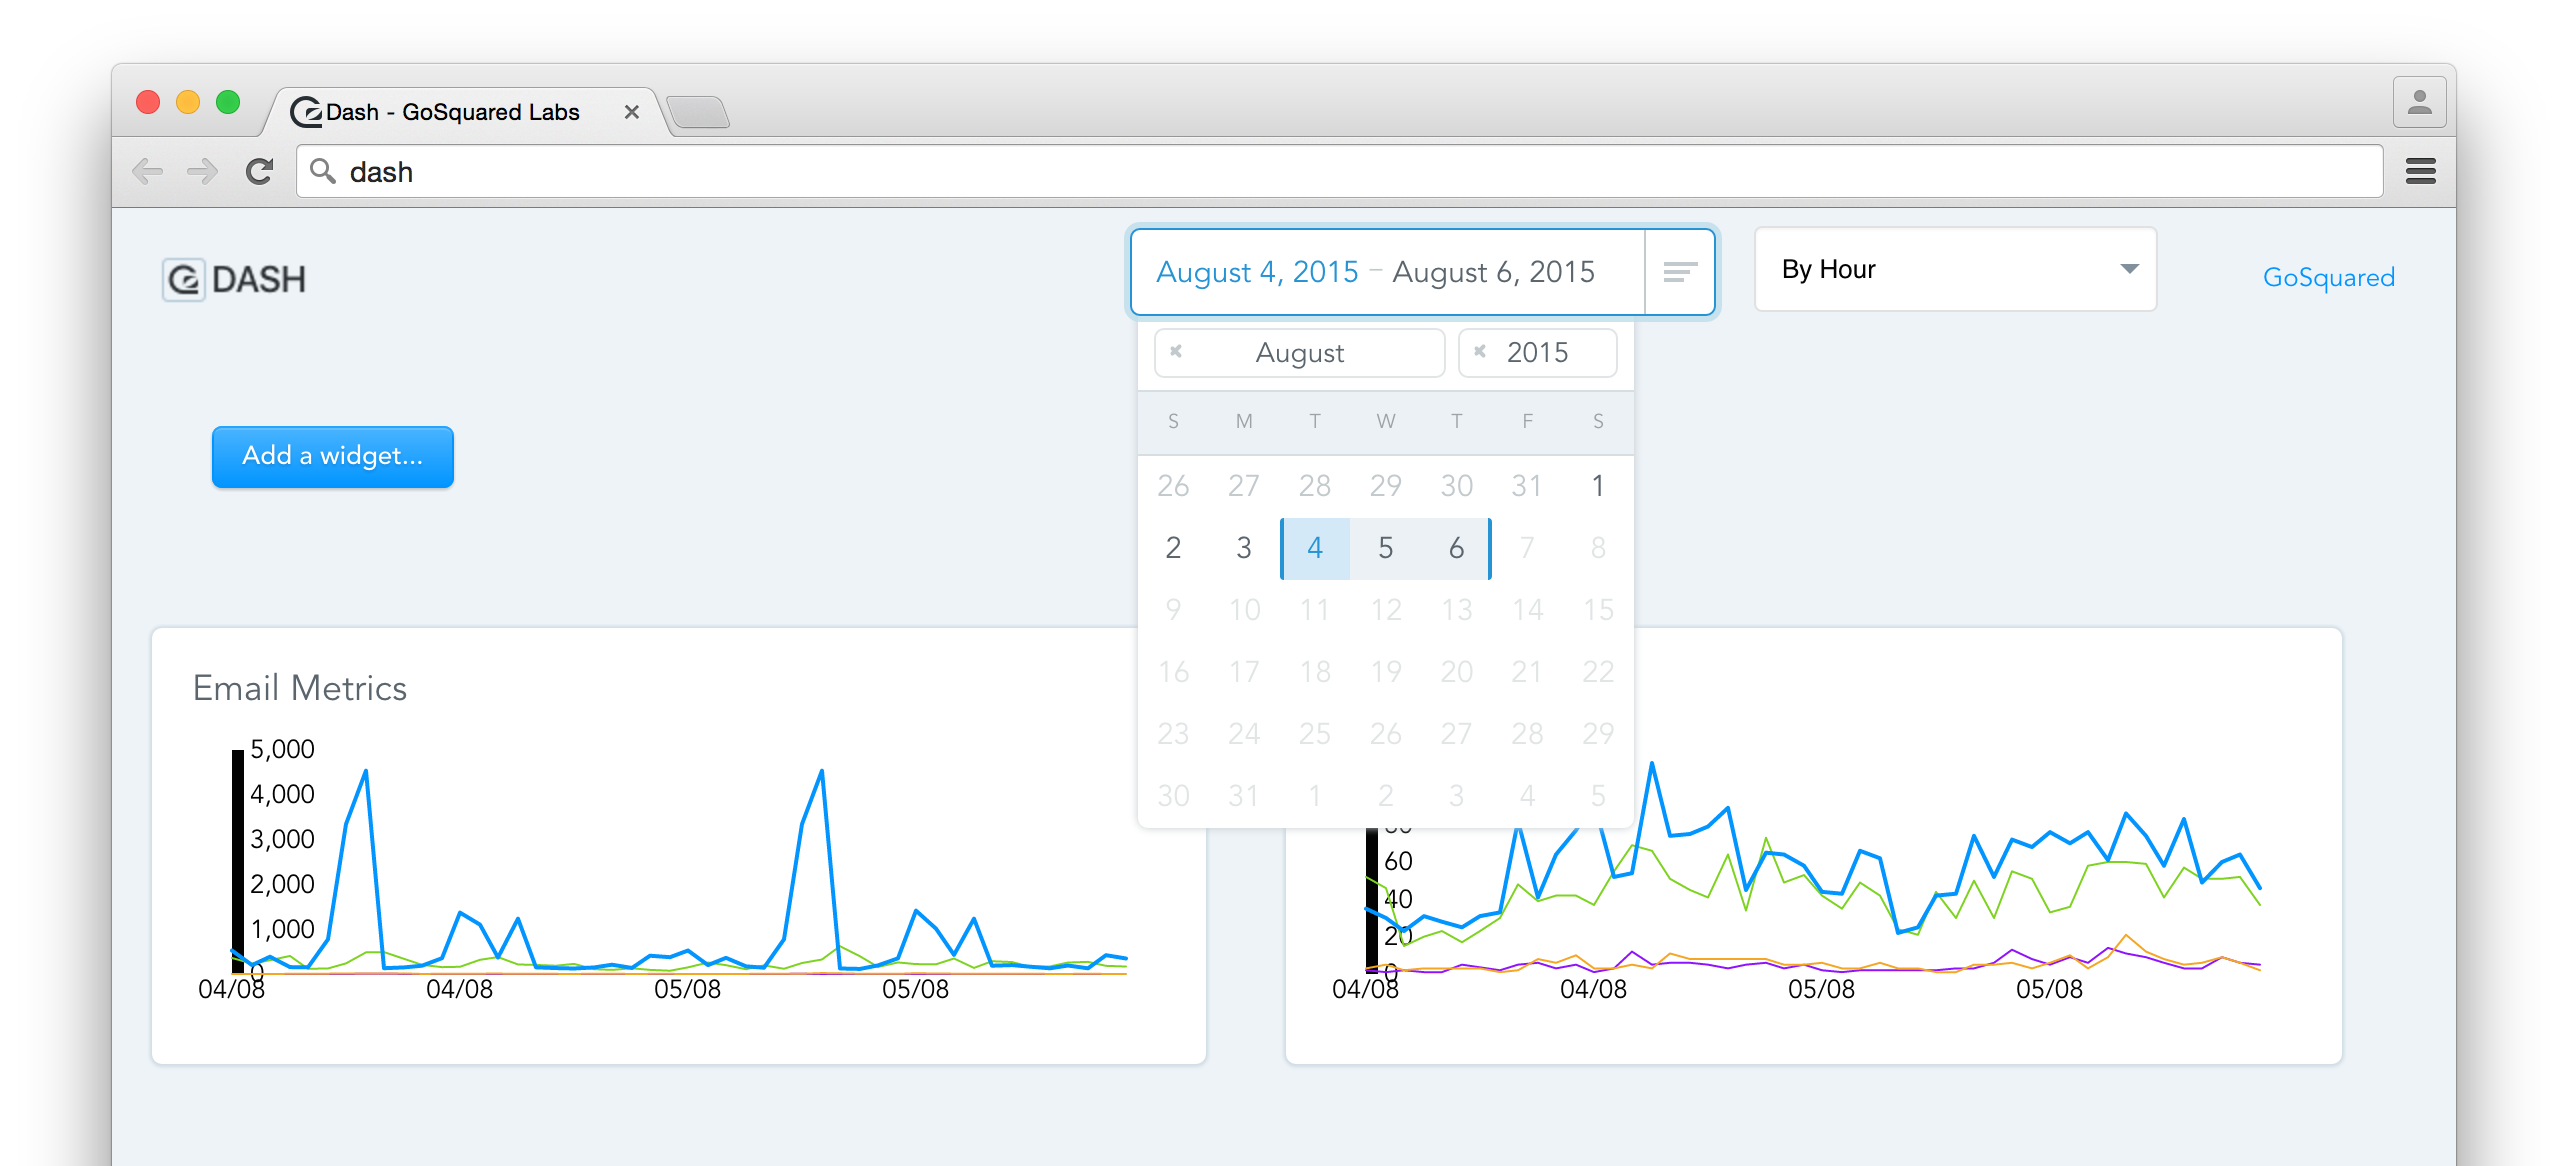
We had recently come across Baremetrics’ open source calendar and we admired its slick functionality and design. We used it for the timeframe selector in Dash, so you can easily set the date range shown in the graphs.
You can also switch the graph resolution between hour, day, week, month and year:

Dash is an exciting step taking us closer to doing more visualisation and aggregation of event data.
You’re able to use dash with any site that’s tracking events and using People Analytics. All you need is an API key – but for now, we’re manually allowing access on a case-by-case basis, so if you’d like access just ask!
Conclusion
These experiments are not only an outlet for our ideas, but actually form an important part of the R&D process at GoSquared. Often a lot of experiments grow into full blown functionality in the main GoSquared service, because they start out as small ideas that we thought would prove useful.