
It’s been a while since our last hack day, and the team was itching to play with ideas. And unlike most of our previous hack days, we actually managed to build and ship some useful features in (almost) a single day.
Diving deep into cohorts

When experimenting with different growth strategies, it’s hard to find many resources that don’t emphasise the importance of Cohort Metrics.
Rather than look at how different strategies affect your general signup and activation numbers, it’s important to make sure you establish that these metrics were being affected by your site’s visitors specifically during the time you were experimenting.
Establishing Cohorts allows you to break your users into related groups for analysis, rather than looking at all users as one unit. For example, you could create cohorts of users who visited your marketing site based on the week they visited. Then, if you make any changes to your creative or copy, you can see how any iterations affected the user’s likelihood to sign up.
At GoSquared we’re always focused on making sure our onboarding process has as little amount of friction as possible. We want users to be able to get the most value out of GoSquared at the earliest opportunity. This Hack Day, Russell created an internal dashboard for us to be able to view how successfully cohorts of our users were activating different features on our platform, after they had signed up for a trial.
We use events in GoSquared to track when a user has successfully activated specific elements of our platform like Analytics, our People CRM and Live Chat. We then store these in a dedicated MySQL table with a timestamp of when they activated; we also have a table of registered users and their respective fields such as signup dates. Russell used Node.js to query our user table to return our cohorts based on signups. He was then able to use a join to return the user’s activation dates and map these into their respective weeks in a table; this enabled us to use graphing libraries to visualise that data.
Since we’re now able to take learnings from our cohorts of users and how our growth strategies are affecting their activation metrics, we can start to answer questions like:
- How does activation look for groups of users who saw one onboarding flow compared to another cohort?
- How long does it take a cohort to activate their second feature? Does the copy they saw on our marketing site affect that?
- How long does it take for a user to go from activating to becoming a paying customer?
Being able to answer questions like this allows us to experiment more effectively and ultimately end up delivering a better experience to our users.
Smart Group counts in People
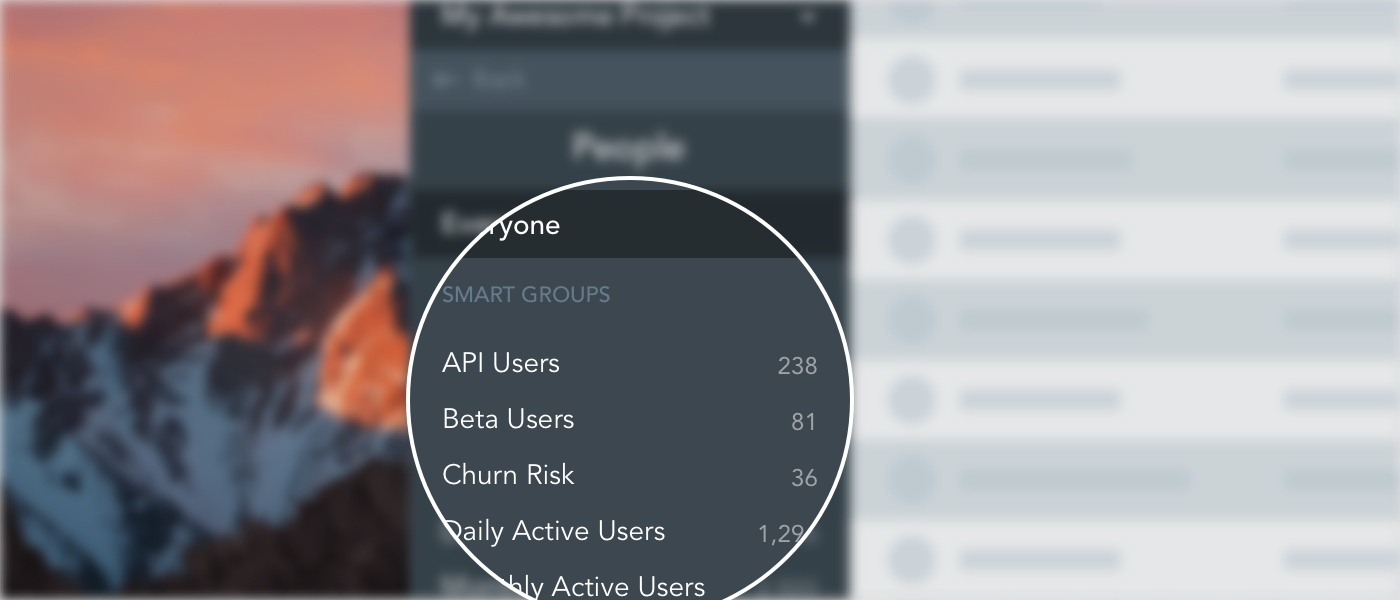
Smart Groups in GoSquared are a convenient way to not only collect segments of users together into one list, but also quickly obtain a count of the total number of users in that list. When you’re searching for a subset of your users, such as paying customers or active users of your product, quickly viewing these counts gives you an instant idea of how well they’re performing.
With this in mind, Geoff set out to make it easier to view the smart group counts. One of the most prominent views of all of your smart groups is the Smart Group list in the sidebar of the People app. So Geoff added a count next to each smart group in the list displaying how many users are currently in the group. Now it is possible to see, at a glance, all of your groups and counts in the sidebar.
For those interested in the behind the scenes, this information was already available internally – our backend already records the number of users in each smart group as part of the enter/exit triggers system; so all that was needed was another way to surface the data.
To do this, Geoff added a couple of internal API endpoints as an initial way of pulling the counts out from an existing backend service. This served well as a proof of concept, and he got the counts rendering in the app fairly quickly.
Once the concept was demo’d and gathered the team’s feedback, we went for a full release into the main product, with a few tweaks. As a performance improvement we now record the counts in some existing MySQL storage for smart groups and pull that into the app along with the data already being retrieved; that and a couple of improvements to when and how we show the counts in various cases, such as when you’ve newly added a smart group, and smart groups without filters.
And there you have it, shipping a feature, from hack to prod in a day.
View Emails in Inbox
Ever since we introduced message sending via email in Live Chat we’ve faced the issue of how to deal with incoming messages that might include attachments, images or formatting.
Since GoSquared’s Live Chat is text-based, when an email is received we parse the content and present it as plain text. The problem comes when the email may include images or other formatting or attachments, and the text representation simply includes [Inline image 1] or even worse, nothing at all:

This is obviously very frustrating, especially if you’re trying to help out a customer and they’re sending you screenshots or other useful information that you just can’t see.
JT set about building a service for fetching the full HTML content of emails received, along with any attachments and formatting, sanitising the data to make it safe for embedding inside Inbox, and serving a fully-formatted version of the HTML email for any given message.
The end result looks something like this:

We rolled out this feature earlier today, so if you’re already using email with Live Chat, you can try it out right now!
ML the things!

The above image is a rare glimpse of machine learning in action. Photo credit to Kinson Leung.
Leo spent the day hacking around with Amazon Machine Learning, intending to create a predictive model for customer churn on the basis of data such as customer activity and engagement, type of plan, number of active projects on the platform, and so on.
It turns out that the hard work is in determining what ‘features’ carry predictive weight for the outcome of interest, and also in transforming the data into an acceptable form for the learning process. Event-based data, in particular, has to be aggregated in some form, whether as the number of occurrences of a given event, the first and last time it occurred, the average duration between occurrences, etc.
That said, once you’re vaguely happy with your set of features, it’s fairly straightforward to chuck the data at Amazon ML in the form of a CSV uploaded to an S3 bucket. You can then train a model to make one of three types of prediction: binary (will a customer churn or not), categorical (will this customer upgrade, downgrade, or stay on the same plan), or regression (what is the predicted lifetime value of this customer).
The algorithms Amazon uses perform what’s called ‘regularisation’, essentially weeding out variables that don’t carry predictive weight, and ensuring that your model is not overfitted to your training data (which would would mean the model is not properly generalising the patterns in the data you’ve fed in). This means you can be fairly liberal with what you throw at the service, provided it’s in a binary, categorical, numerical, or textual form.
Ultimately, however, the model you train is unlikely to be perfect, and this is where a trade-off has to be made. In the case of predicting churn, we would rather falsely flag someone as likely to churn — giving us a chance to reach out to a customer — than miss someone who is in fact looking to leave. For this scenario, we can therefore tune the model to err on the side of producing false positives.